3.5 KiB
Custom Log Console
Overview
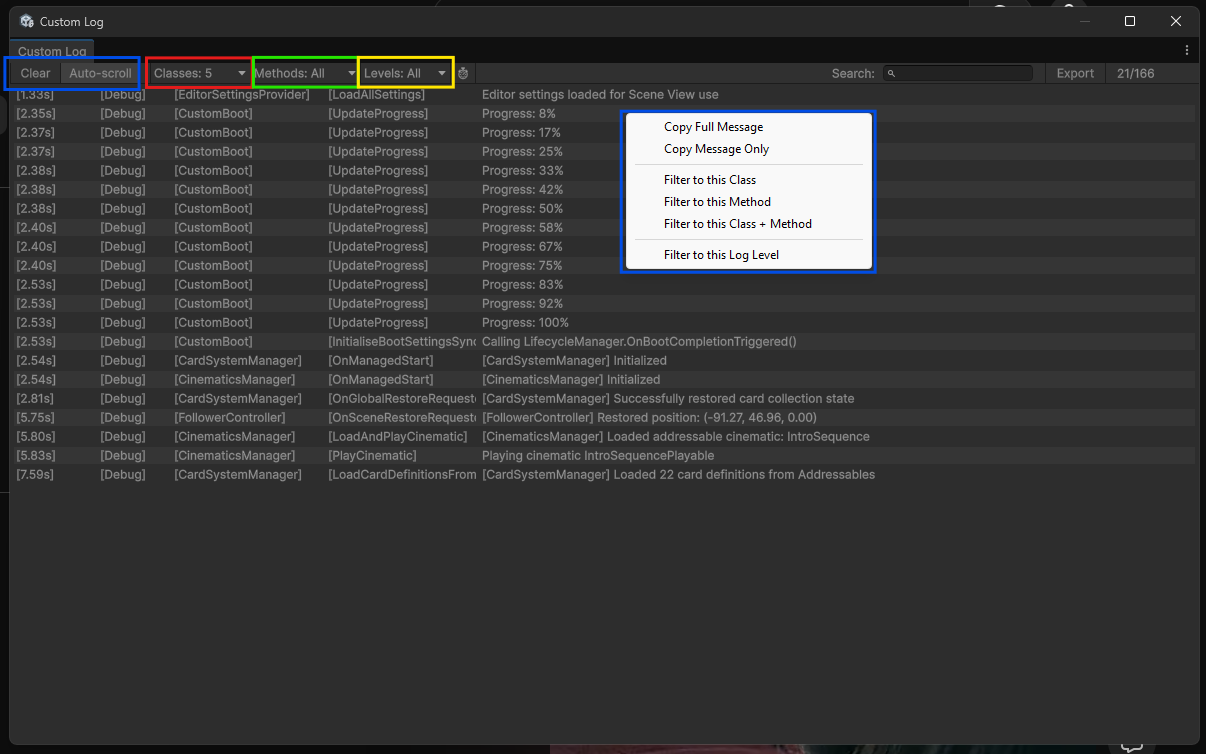
A centralized logging system with an advanced filtering console that automatically tags log entries with class and method names. Provides powerful filtering capabilities beyond Unity's default console, including multi-select filters, text search, time-range filtering, and log export.
Using the Logging System in Code
All logging automatically captures the calling class and method name using CallerMemberName and CallerFilePath attributes. Simply call the static logging methods:
using Core;

public class MyClass : ManagedBehaviour
{
    internal override void OnManagedStart()
    {
        Logging.Debug("Initialization complete");
        Logging.Info("Player spawned at position");
        Logging.Warning("Missing configuration, using defaults");
        Logging.Error("Failed to load required asset");
    }
}
Output format:
[ClassName][MethodName] Your message
Available methods:
Logging.Debug(string message)- Detailed diagnostic informationLogging.Info(string message)- General informational messagesLogging.Warning(string message)- Non-critical issuesLogging.Error(string message)- Critical errors
Note: All logs are broadcast via the Logging.OnLogEntryAdded event and stored in a central buffer accessible via Logging.GetRecentLogs().
Opening the Console Window
Menu: AppleHills > Custom Log Console
You can open multiple independent console instances with different filter configurations to monitor separate systems simultaneously
Console Interface
Toolbar Controls
🔵 Basic Controls (Blue outline)
- Clear - Clears all log entries and resets tag lists
- Auto-scroll - Automatically scrolls to newest entries when enabled
Filter Buttons (Persistent Popups)
All filter buttons open persistent popup windows that remain open during multi-selection. Changes apply when you click "Apply" or dismiss with "Close".
-
🔴 Classes Filter (Red outline)
- Multi-select which classes to display
- Includes search box for quick filtering
- All/None quick actions
-
🟢 Methods Filter (Green outline)
- Multi-select which methods to display
- Includes search box for quick filtering
- All/None quick actions
-
🟡 Levels Filter (Yellow outline)
- Toggle Debug, Info, Warning, Error levels
- All/None quick actions
-
⏱ Time Filter
- Opens utility window with MinMaxSlider
- Filter logs by timestamp range
- Enable/disable toggle with reset option
Search & Export
- Search - Full-text search across class names, method names, and message content
- Export - Save filtered logs to .txt file with timestamp
- Count - Shows
filtered/totallog count
Visual Indicators
Color Coding:
- White: Debug/Info (normal operation)
- Yellow: Warning (non-critical issues)
- Red: Error (critical failures)
Alternating Rows: Light/dark grey backgrounds improve readability for dense log output.
Technical Details
Event Broadcasting:
Logging.OnLogEntryAdded += (LogEntry entry) => { /* handle */ };
Manual Log Retrieval:
List<LogEntry> recentLogs = Logging.GetRecentLogs();
LogEntry Structure:
ClassName- Captured from calling file pathMethodName- Captured fromCallerMemberNameMessage- User-provided message textLevel- Debug/Info/Warning/Error enumTimestamp- Time.realtimeSinceStartupFullFormattedMessage- Complete formatted string
